
100 U.S. Hunting & Fishing Statistics, November 2026
Updated November 2026.
A season is more than a harvest total. It includes the people who came along, the places you returned to, and the details you would like to remember. These statistics provide context for those days in the field and on the water.
This reference brings together national participation research, federal surveys, public-land records and conservation funding. Every observation carries its source and date. Recent fishing estimates and older hunting benchmarks use different populations and methods, so they are presented separately rather than turned into one misleading trend.
Key Takeaways
- Americans who fished: 57 million. U.S. residents ages 6+, 2025; category participation overlaps. (ASA / Outdoor Foundation / SMS, July 2026).
- Hunters, all hunting types: 14.4 million. U.S. residents ages 16+, 2022; hunting types overlap. (U.S. Fish & Wildlife Service / NORC, October 2023).
- Fishing outings, all categories: 918 million. 2025 national participation study, ages 6+; activities overlap. (ASA / Outdoor Foundation / SMS, July 2026).
- Hunting days, all hunting types: 241 million. 2022 U.S. residents ages 16+; rounded estimates; days are not trips. (U.S. Fish & Wildlife Service / NORC, October 2023).
- Anglers introduced to fishing before age 12: 86%. Retrospective introduction-age response in the 2026 report; chart does not specify its question-level sample size; not a follow-up of children. (ASA / Outdoor Foundation / SMS, July 2026).
- Positive association: time with family or friends: 75%. Early-2026 adult supplemental survey; ALL column; multiple responses allowed; final row is a different question. (ASA / Outdoor Foundation / SMS, July 2026).
- Total annual hunting expenditure: 45.2 billion USD. 2022 U.S. residents ages 16+; nominal historical dollars; selected categories, not a complete budget. (U.S. Fish & Wildlife Service / NORC, October 2023).
- Total annual fishing expenditure: 99.4 billion USD. 2022 U.S. residents ages 16+; nominal historical dollars; values rounded from Table 3. (U.S. Fish & Wildlife Service / NORC, October 2023).
- Public land managed by BLM: 245 million acres. September 2026 agency description; grouped activities, not a site-specific access promise. (Bureau of Land Management, September 2026).
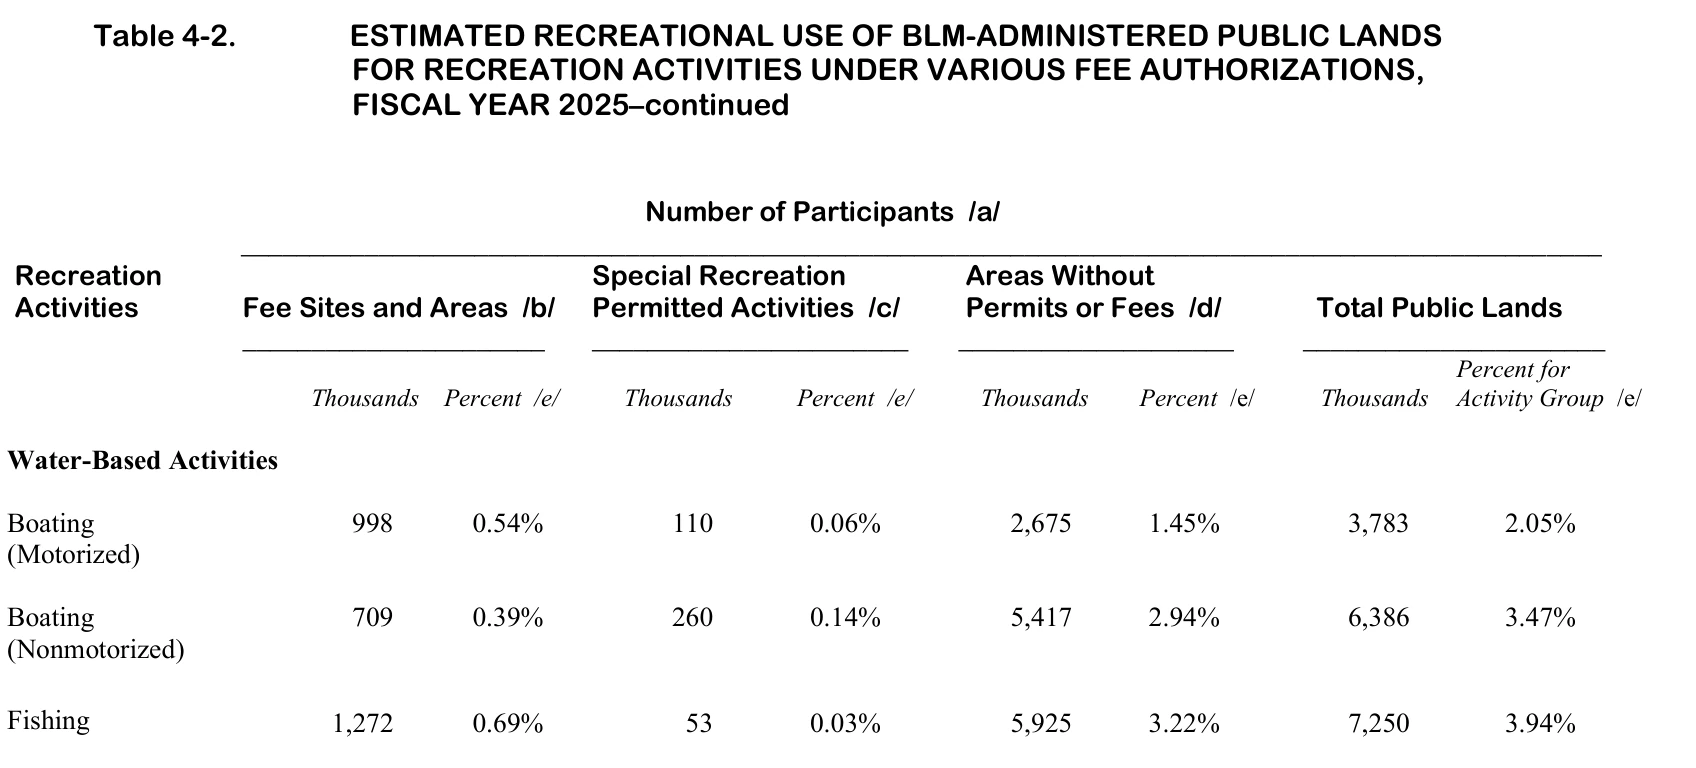
- Fishing participations: all areas: 7.250 million. Fiscal 2025 visitor-activity events, not unique annual participants; hunting and shooting combined. (Bureau of Land Management, July 2026).
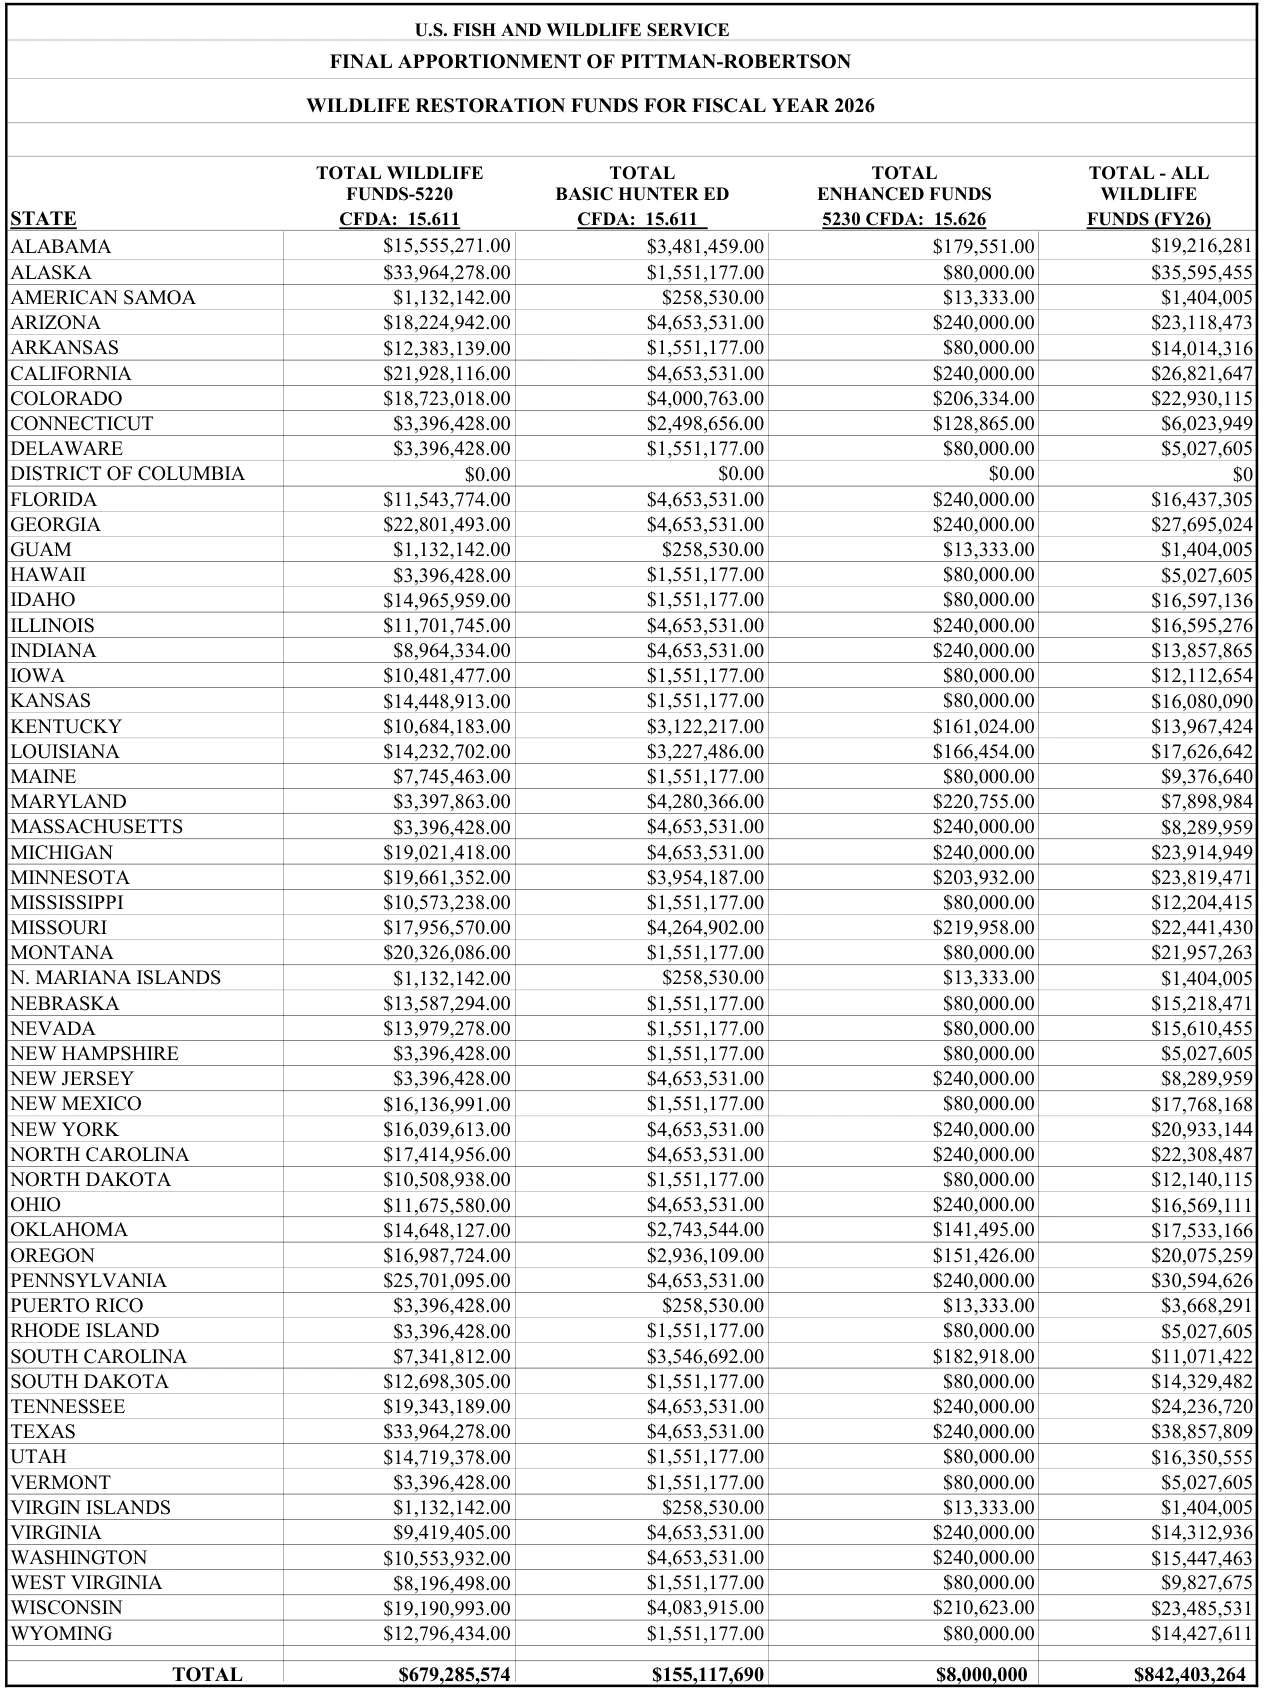
- Combined FY2026 restoration apportionments: Over 1.2 billion USD. February 2026 announcement; annual and cumulative measures kept separate. (U.S. Fish & Wildlife Service, February 2026).
- Fishing access areas supported: Over 9,000. Cumulative program-supported capacity described February 2026, except fish stocking explicitly annual. (U.S. Fish & Wildlife Service, February 2026).
Who hunts and fishes in the United States?
Start with the people behind the numbers. Hunting and fishing surveys describe overlapping communities, but their age cutoffs and reporting years differ.
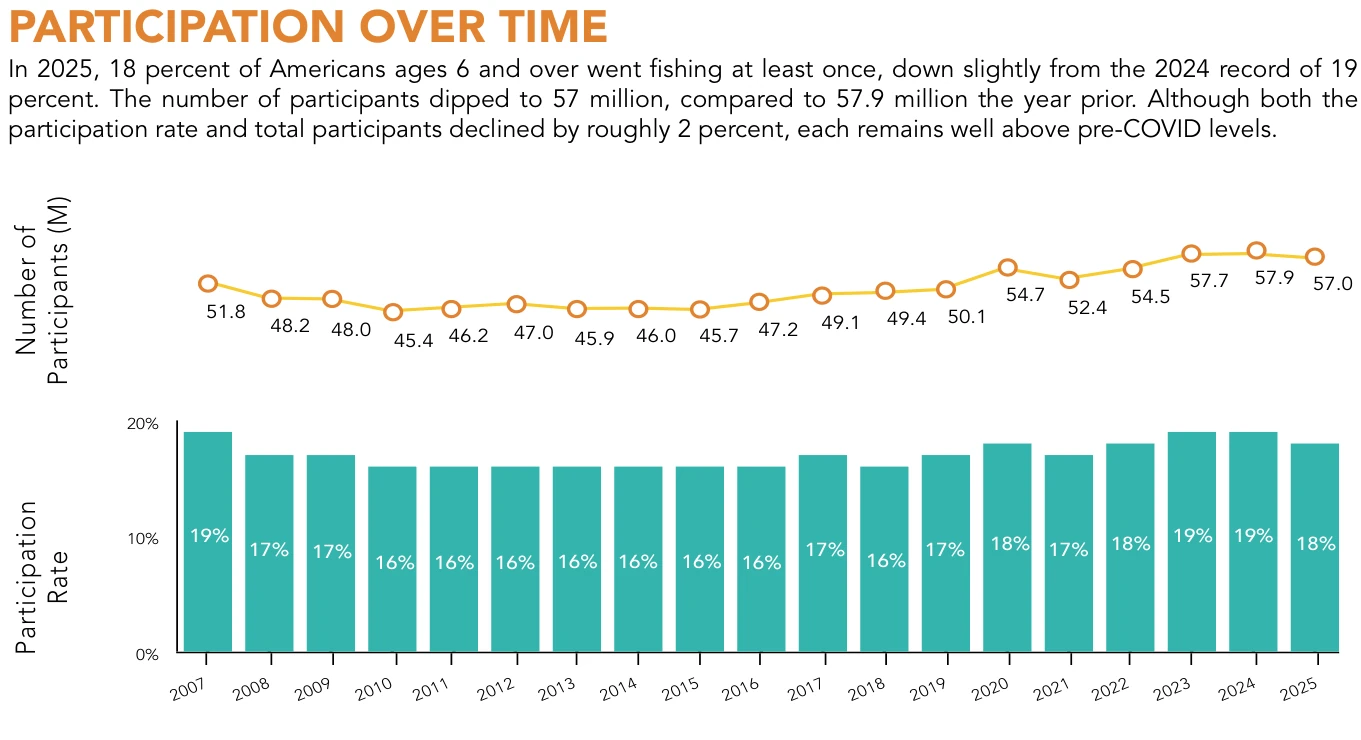
How many Americans go fishing?
The recent industry study counts participation across fishing categories. Its population begins in childhood, and an angler can appear in more than one activity category. The figures below therefore describe different views of the same community; adding freshwater, saltwater and fly-fishing counts would overstate its total size. The figures here describe U.S. residents ages six and older in 2025.
| Measurement | Reported result | Primary source |
|---|---|---|
| National fishing participation rate | 18% | (ASA / Outdoor Foundation / SMS, July 2026) |
| Freshwater anglers | 42.6 million | (ASA / Outdoor Foundation / SMS, July 2026) |
| Saltwater anglers | 15.5 million | (ASA / Outdoor Foundation / SMS, July 2026) |
| Fly-fishing participants | 7.9 million | (ASA / Outdoor Foundation / SMS, July 2026) |
| Female anglers | 21.1 million | (ASA / Outdoor Foundation / SMS, July 2026) |
| Black anglers | Nearly 6 million | (ASA / Outdoor Foundation / SMS, July 2026) |
| Hispanic anglers | 6.9 million | (ASA / Outdoor Foundation / SMS, July 2026) |
Which types of hunting do people pursue?
The federal benchmark measures participation among residents sixteen and older in a historical survey year. The same person can hunt multiple types of game, so these are overlapping categories. The report’s big-game definition includes wild turkey as well as animals such as deer and elk. Keep that definition in mind when comparing your own outing categories. These estimates describe U.S. residents ages sixteen and older in 2022.
| Measurement | Reported result | Primary source |
|---|---|---|
| Big-game hunters | 11.5 million | (U.S. Fish & Wildlife Service / NORC, October 2023) |
| Small-game hunters | 5.3 million | (U.S. Fish & Wildlife Service / NORC, October 2023) |
| Migratory-bird hunters | 2.8 million | (U.S. Fish & Wildlife Service / NORC, October 2023) |
| Hunters pursuing other animals | 2.3 million | (U.S. Fish & Wildlife Service / NORC, October 2023) |
How does hunting participation vary across people and places?
The federal survey also reports age, sex and residential geography. Counts identify how many participants belong to a category, while participation rates describe a share of the resident population. They answer different questions. The male and female rows are selected categories, rather than an exhaustive restatement of the survey’s gender results. These selected characteristics also come from the 2022 survey of residents ages sixteen and older.
| Measurement | Reported result | Primary source |
|---|---|---|
| Male hunters | 11.0 million | (U.S. Fish & Wildlife Service / NORC, October 2023) |
| Female hunters | 3.1 million | (U.S. Fish & Wildlife Service / NORC, October 2023) |
| Hunters ages 35–44 | 2.8 million | (U.S. Fish & Wildlife Service / NORC, October 2023) |
| Rural residents who hunted | 12% | (U.S. Fish & Wildlife Service / NORC, October 2023) |
| Urban residents who hunted | 4% | (U.S. Fish & Wildlife Service / NORC, October 2023) |
How much time do hunters and anglers spend outside?
A season’s story depends on what was counted. One person can take repeated outings, and a trip can span multiple days.
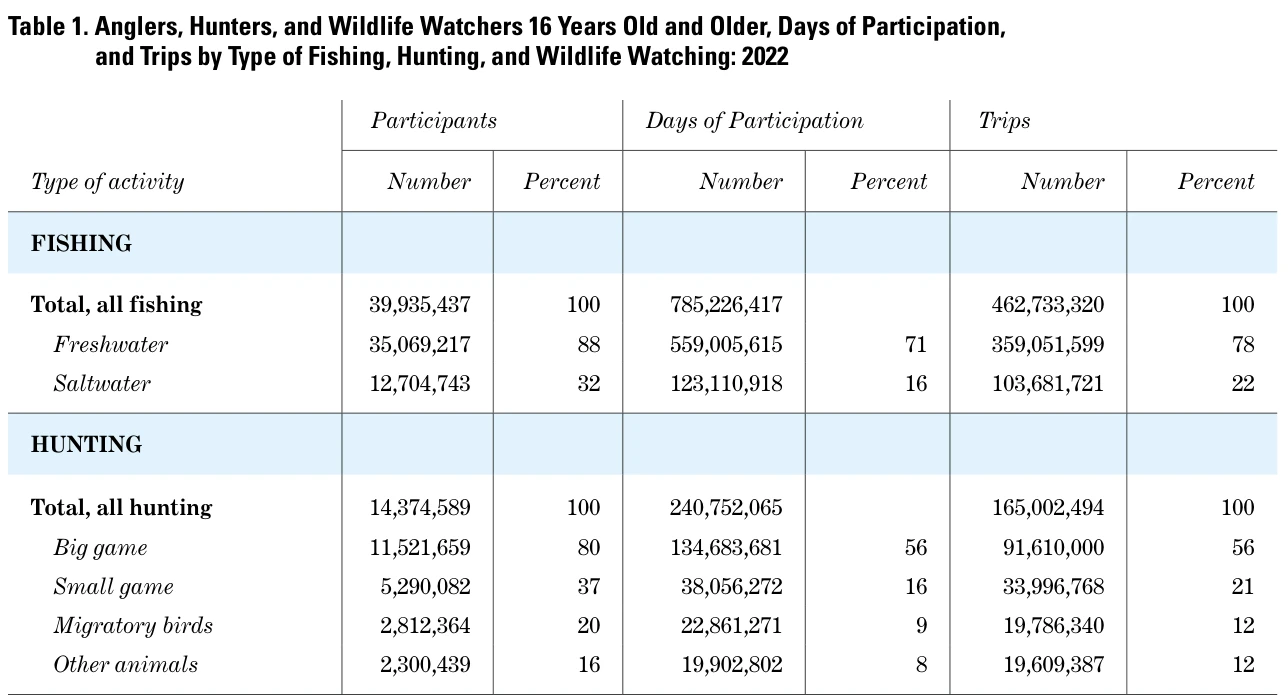
How frequent are fishing outings?
The fishing report measures both the total number of outings and their average frequency. These national estimates include occasional anglers as well as frequent participants. A category total is a view of fishing activity, not an instruction for how often to go. Personal journal entries can preserve the details that a national average cannot describe. These are 2025 national estimates for participants ages six and older.
| Measurement | Reported result | Primary source |
|---|---|---|
| Average outings per angler | 16 | (ASA / Outdoor Foundation / SMS, July 2026) |
| Freshwater outings | 652 million | (ASA / Outdoor Foundation / SMS, July 2026) |
| Fly-fishing outings | 83 million | (ASA / Outdoor Foundation / SMS, July 2026) |
How do hunting days differ from hunting trips?
The federal table reports both measures for the same historical year. A trip is not interchangeable with a day, and separate hunting categories should not be assumed to sum exactly to the overall total. Rounded figures provide readable context for activity types without suggesting that all seasons, locations or hunters follow the same pattern. The figures below describe 2022 activity by U.S. residents ages sixteen and older.
| Measurement | Reported result | Primary source |
|---|---|---|
| Hunting trips, all hunting types | 165 million | (U.S. Fish & Wildlife Service / NORC, October 2023) |
| Big-game hunting days | 135 million | (U.S. Fish & Wildlife Service / NORC, October 2023) |
| Big-game hunting trips | 92 million | (U.S. Fish & Wildlife Service / NORC, October 2023) |
| Small-game hunting days | 38 million | (U.S. Fish & Wildlife Service / NORC, October 2023) |
| Small-game hunting trips | 34 million | (U.S. Fish & Wildlife Service / NORC, October 2023) |
| Migratory-bird hunting days | 23 million | (U.S. Fish & Wildlife Service / NORC, October 2023) |
| Migratory-bird hunting trips | 20 million | (U.S. Fish & Wildlife Service / NORC, October 2023) |
What do marine fishing records measure?
NOAA reports marine effort and catch using another survey system. Released fish and harvested fish are separate outcomes; neither is a count of unique anglers. The selected state figures are examples within that marine dataset. Survey differences and incomplete reporting in some states limit comparisons, particularly across states that use different methods. These are 2024 marine estimates for the continental United States and Hawai‘i, with state examples labeled.
| Measurement | Reported result | Primary source |
|---|---|---|
| Marine recreational trips, covered U.S. regions | 193.723 million | (NOAA Fisheries, October 2026) |
| Marine recreational finfish caught | 1,012.287 million fish | (NOAA Fisheries, October 2026) |
| Finfish released | 692.984 million fish | (NOAA Fisheries, October 2026) |
| Finfish harvested | 319.302 million fish | (NOAA Fisheries, October 2026) |
| Florida marine recreational trips | 80.007 million | (NOAA Fisheries, October 2026) |
| North Carolina marine recreational trips | 18.571 million | (NOAA Fisheries, October 2026) |
Keep the context of your own season in a Field Chapters journal: outing dates, locations, conditions, observations and the people who were there.
How do outdoor traditions and shared memories begin?
The social side of an outing deserves space beside its catch or harvest. Participation counts and adult memories offer different perspectives on that experience.
When do people first try fishing?
The participation study describes children, teenagers and first-time anglers, while a retrospective question looks back at early experiences. The latter is retrospective: it does not follow children forward or prove that an early introduction causes lifelong participation. Both perspectives are useful when thinking about which first outings and family stories to preserve. Youth and first-timer counts describe 2025; the introduction-age item is a separate retrospective response whose chart does not specify its question-level sample size.
| Measurement | Reported result | Primary source |
|---|---|---|
| Children ages 6–12 who fished | 7.4 million | (ASA / Outdoor Foundation / SMS, July 2026) |
| Teenagers ages 13–17 who fished | 5.4 million | (ASA / Outdoor Foundation / SMS, July 2026) |
| First-time fishing participants, ages 6+ | 6.3 million | (ASA / Outdoor Foundation / SMS, July 2026) |
Who usually goes along on a fishing trip?
Adults in the supplemental study reported typical group sizes and companion makeup. Those are separate questions. A group size includes the respondent, whereas companion makeup describes the people accompanying them. A respondent fishing with children is still an adult survey participant; the results are not a survey completed by those children. These responses come from the early-2026 supplemental adult study, whose sample consisted of adults who fished in 2025.
| Measurement | Reported result | Primary source |
|---|---|---|
| Adults typically fishing alone | 18% | (ASA / Outdoor Foundation / SMS, July 2026) |
| Adults typically fishing in a group of two | 36% | (ASA / Outdoor Foundation / SMS, July 2026) |
| Adults typically fishing in a group of three to five | 41% | (ASA / Outdoor Foundation / SMS, July 2026) |
| Adults typically fishing in a group of six or more | 5% | (ASA / Outdoor Foundation / SMS, July 2026) |
| Companion makeup: adults only | 53% | (ASA / Outdoor Foundation / SMS, July 2026) |
| Companion makeup: adults and children | 38% | (ASA / Outdoor Foundation / SMS, July 2026) |
| Companion makeup: children only | 9% | (ASA / Outdoor Foundation / SMS, July 2026) |
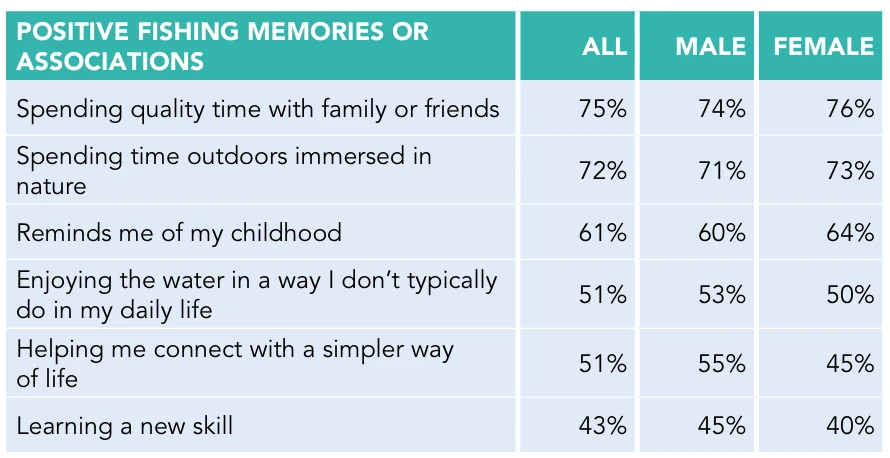
Which memories do adult anglers associate with fishing?
Respondents selected several positive associations, so the percentages overlap. Family time, childhood memories and learning a skill are self-reported associations, not measured benefits of using a journal. The final row asks about the best things about fishing, a different question from the memories table. Preserving names, photos and a short story can give your own outing those details. These responses also come from the early-2026 adult supplement, using the overall response column.
| Measurement | Reported result | Primary source |
|---|---|---|
| Positive association: time outdoors in nature | 72% | (ASA / Outdoor Foundation / SMS, July 2026) |
| Positive association: childhood memories | 61% | (ASA / Outdoor Foundation / SMS, July 2026) |
| Positive association: enjoying the water differently | 51% | (ASA / Outdoor Foundation / SMS, July 2026) |
| Positive association: a simpler way of life | 51% | (ASA / Outdoor Foundation / SMS, July 2026) |
| Positive association: learning a skill | 43% | (ASA / Outdoor Foundation / SMS, July 2026) |
| Best thing about fishing: time with family or friends | 44% | (ASA / Outdoor Foundation / SMS, July 2026) |
Turn selected outings and photographs into a digital collection. Read a sample Field Chapters book or explore membership options.
What goes into the cost and economic footprint of a season?
Separate personal expenditure from economic value added. Both describe resources connected with outdoor activity, but they measure different things.
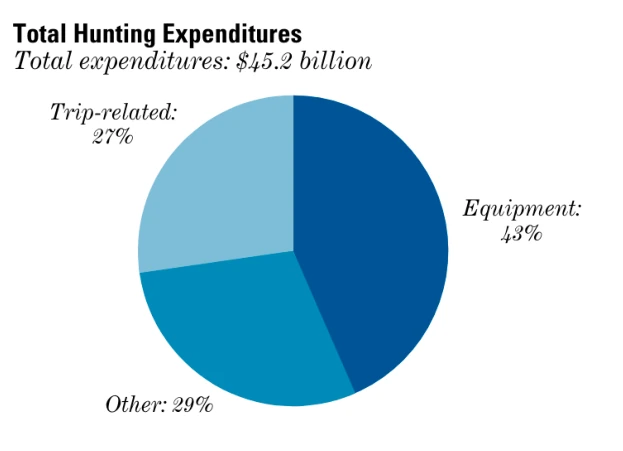
What did hunters spend in the federal benchmark?
The expenditure survey estimates historical annual spending by adult hunters. Its categories include equipment that may last beyond a single season and other items outside the selected rows. These are national totals in the dollars of the survey year, rather than an individual budget, current price guide or cost required to begin hunting. All amounts in this subsection describe 2022 expenditure by residents ages sixteen and older.
| Measurement | Reported result | Primary source |
|---|---|---|
| Hunting trip-related expenditure | 12.3 billion USD | (U.S. Fish & Wildlife Service / NORC, October 2023) |
| Hunting equipment expenditure | 7.9 billion USD | (U.S. Fish & Wildlife Service / NORC, October 2023) |
| Auxiliary hunting equipment expenditure | 3.9 billion USD | (U.S. Fish & Wildlife Service / NORC, October 2023) |
| Special hunting equipment expenditure | 7.7 billion USD | (U.S. Fish & Wildlife Service / NORC, October 2023) |
What did anglers spend in that same survey?
The same federal study distinguishes trip costs, fishing equipment and other equipment. A special-equipment category can include major purchases, while auxiliary equipment covers a different set of items. The selected rows are not the complete expenditure breakdown. Their purpose is to show the breadth of a season’s resources, without suggesting that every angler purchases each item. These are also 2022 expenditure estimates for residents ages sixteen and older.
| Measurement | Reported result | Primary source |
|---|---|---|
| Fishing trip-related expenditure | 36.6 billion USD | (U.S. Fish & Wildlife Service / NORC, October 2023) |
| Fishing equipment expenditure | 8.7 billion USD | (U.S. Fish & Wildlife Service / NORC, October 2023) |
| Auxiliary fishing equipment expenditure | 4.3 billion USD | (U.S. Fish & Wildlife Service / NORC, October 2023) |
| Special fishing equipment expenditure | 27.7 billion USD | (U.S. Fish & Wildlife Service / NORC, October 2023) |
How do boating, fishing and hunting contribute economically?
BEA’s current-dollar value added measures economic contribution rather than the money consumers spent. Its activity groupings also extend beyond fishing or hunting alone. The state examples preserve those combined definitions. They should not be compared with the earlier survey totals as if they measured growth in personal spending. These figures describe 2024 current-dollar value added within the named combined activities.
| Measurement | Reported result | Primary source |
|---|---|---|
| Boating/fishing: U.S. value added | 38.4 billion USD | (U.S. Bureau of Economic Analysis, March 2026) |
| Boating/fishing: Florida value added | 4.4 billion USD | (U.S. Bureau of Economic Analysis, March 2026) |
| Boating/fishing: California value added | 3.3 billion USD | (U.S. Bureau of Economic Analysis, March 2026) |
| Boating/fishing: Texas value added | 3.0 billion USD | (U.S. Bureau of Economic Analysis, March 2026) |
| Hunting/shooting/trapping: U.S. value added | 16.5 billion USD | (U.S. Bureau of Economic Analysis, March 2026) |
| Hunting/shooting/trapping: Texas value added | 2.0 billion USD | (U.S. Bureau of Economic Analysis, March 2026) |
| Hunting/shooting/trapping: Florida value added | 974.6 million USD | (U.S. Bureau of Economic Analysis, March 2026) |
| Hunting/shooting/trapping: California value added | 817.5 million USD | (U.S. Bureau of Economic Analysis, March 2026) |
Where do public lands fit into hunting and fishing?
Public-land statistics show the scale of places and use. They do not replace checking the rules, routes and conditions for a specific outing.
How large is BLM’s recreation setting?
The agency’s land description covers a broad western landscape and groups several recreational activities. Open-land wording is not a guarantee that a particular hunting or fishing activity is allowed everywhere. Its visitation estimate counts visits across all recreation, including repeat visits. It is not a headcount of hunters or anglers. The land description is from September 2026; the visit estimate covers fiscal 2025.
| Measurement | Reported result | Primary source |
|---|---|---|
| BLM land described as open to hunting, fishing or other recreation | Over 99% | (Bureau of Land Management, September 2026) |
| Total BLM recreation visits, all activities | 84.178 million | (Bureau of Land Management, July 2026) |
How does BLM record hunting and fishing activity?
The administrative system counts a visitor participating in an activity during a visit. Repeat visits count, and one visitor can contribute to more than one activity group. Hunting and shooting are combined in the published category. Fee authorizations describe where participation was recorded; they do not tell a reader whether a particular future outing needs a license or permit. These activity records cover fiscal 2025.
| Measurement | Reported result | Primary source |
|---|---|---|
| Hunting/shooting participations: fee sites | 119,000 | (Bureau of Land Management, July 2026) |
| Hunting/shooting participations: special recreation permits | 18,000 | (Bureau of Land Management, July 2026) |
| Hunting/shooting participations: areas without permits or fees | 12.325 million | (Bureau of Land Management, July 2026) |
| Hunting/shooting participations: all areas | 12.462 million | (Bureau of Land Management, July 2026) |
| Fishing participations: fee sites | 1.272 million | (Bureau of Land Management, July 2026) |
| Fishing participations: special recreation permits | 53,000 | (Bureau of Land Management, July 2026) |
| Fishing participations: areas without permits or fees | 5.925 million | (Bureau of Land Management, July 2026) |
How do administrative areas illustrate recreation use?
Selected office totals provide examples of the agency’s geographic reporting. They cover all recreation, rather than hunting and fishing alone. Administrative boundaries can extend beyond the state in an office’s name; Montana includes the Dakotas, and Wyoming’s office also administers lands in Nebraska. These totals are not estimates of unique resident participants. These administrative-office estimates also cover fiscal 2025.
| Measurement | Reported result | Primary source |
|---|---|---|
| Colorado administrative office: recreation visits | 10.561 million | (Bureau of Land Management, July 2026) |
| Montana/Dakotas administrative office: recreation visits | 5.565 million | (Bureau of Land Management, July 2026) |
| Wyoming administrative office: recreation visits | 3.634 million | (Bureau of Land Management, July 2026) |
How do hunting and fishing connect with conservation?
Funding and land designations describe two parts of stewardship. Keep a fiscal-year allocation separate from decades of investment or an inventory of existing places.
What funding supports restoration and hunter education?
The federal announcement covers combined restoration programs, while the detailed table covers Wildlife Restoration specifically. Cumulative investments are marked as historical. Hunter education appears within the Wildlife Restoration allocation, so adding it to the program total would double-count funding. These amounts do not measure contributions by Field Chapters or its members. Annual allocations describe fiscal 2026; the other investment totals are explicitly cumulative.
| Measurement | Reported result | Primary source |
|---|---|---|
| Federal apportionments distributed since 1937 | Over 31 billion USD | (U.S. Fish & Wildlife Service, February 2026) |
| Partner-agency investments over program history | Over 10 billion USD | (U.S. Fish & Wildlife Service, February 2026) |
| FY2026 all Wildlife Restoration funds | 842,403,264 USD | (U.S. Fish & Wildlife Service, February 2026) |
| FY2026 Basic Hunter Education allocation | 155,117,690 USD | (U.S. Fish & Wildlife Service, February 2026) |
What infrastructure and management does the program support?
The agency describes facilities, access areas and management supported through the program’s history, with fish stocking expressed as an annual scale. Those statements are not counts of new facilities built in the announced fiscal year. They illustrate the kind of work the funding supports without attributing a particular project to an individual equipment purchase. The agency described these supported capacities in February 2026.
| Measurement | Reported result | Primary source |
|---|---|---|
| Mammal and bird species supported by monitoring/management | Over 800 species | (U.S. Fish & Wildlife Service, February 2026) |
| Fish stocked annually with program support | Over 1 billion fish | (U.S. Fish & Wildlife Service, February 2026) |
| Target ranges supported | Over 800 | (U.S. Fish & Wildlife Service, February 2026) |
| State land opened to hunting and angling with program support | Over 36 million acres | (U.S. Fish & Wildlife Service, February 2026) |
Which conservation designations appear in BLM’s inventory?
The agency reports designated areas, acreage, rivers and river mileage as an inventory at a specific date. Those values are not additions made during that year. Area counts and acreage describe different aspects of the same system and should not be added together. A conservation designation also does not establish which recreational activities are permitted at a particular site. This inventory is dated September 30, 2025.
| Measurement | Reported result | Primary source |
|---|---|---|
| BLM Wilderness Areas | 263 | (Bureau of Land Management, July 2026) |
| BLM Wilderness Area acreage | 10,185,931 acres | (Bureau of Land Management, July 2026) |
| BLM National Wild and Scenic Rivers | 81 | (Bureau of Land Management, July 2026) |
| BLM Wild and Scenic River mileage | 2,699 miles | (Bureau of Land Management, July 2026) |
Methodology and Sources
The article contains 100 individually cited statistical observations from eight primary documents, with twelve takeaways and the remaining observations in body tables. Each observation appears once in the prose and tables; original source figures may display values discussed in the article. Sources were checked November 4, 2026. Reporting years remain explicit: the 2026 fishing report includes 2025 participation data and an early-2026 adult supplement; the federal recreation survey describes 2022; NOAA and BEA describe 2024; BLM records principally describe fiscal 2025. Current policy and site-access rules are not inferred from those historical numbers. The producer concentration check aggregates all selected FWS documents, rather than treating each report as an independent producer. Research selection does not claim improved catches, harvests, wellbeing or retention from journaling. No Field Chapters usage or customer outcomes are estimated. Sources, links and reporting periods are intended for monthly editorial review; no automatic update task has been scheduled.
Glossary
- Participant: A person in a survey’s defined population who reported an activity. BLM activity participation instead counts a visitor-activity event on a visit.
- Trip / day / outing: Distinct measures defined by each producer; they are not interchangeable.
- Harvest / release: Fish kept versus returned to the water; catch can include both.
- Value added: Economic contribution measured by BEA, distinct from consumer spending or gross sales.
- Fiscal year: A government accounting period, which can differ from a calendar year.
- Apportionment: Funding allocated under a program; it is not a measure of completed projects.
- PAC / SMS: Physical Activity Council / Sports Marketing Surveys, named in the fishing report’s research methodology.
Sources
- ASA / Outdoor Foundation / SMS: 2026 Special Report on Fishing. July 2026. 2025 participation survey; separate supplemental adult survey in early 2026.
- U.S. Fish & Wildlife Service / NORC: 2022 National Survey of Fishing, Hunting, and Wildlife-Associated Recreation. October 2023. Calendar 2022; released October 12, 2023.
- NOAA Fisheries: Fisheries of the United States, 2024. October 2026. Calendar 2024; report October 2026.
- U.S. Bureau of Economic Analysis: Outdoor Recreation Economic Statistics, U.S. and States, 2024. March 2026. Calendar 2024; released March 5, 2026.
- Bureau of Land Management: Public Land Statistics 2025. July 2026. Fiscal 2025; conservation designations as of September 30, 2025; report dated July 2026.
- Bureau of Land Management: BLM Showcases Local Recreation Treasures Ahead of National Hunting and Fishing Day. September 2026. Agency description September 25, 2026.
- U.S. Fish & Wildlife Service: 2026 Wildlife and Sport Fish Restoration apportionments. February 2026. Fiscal 2026 announcement February 13; several cumulative program-history measures.
- U.S. Fish & Wildlife Service: Final FY2026 Wildlife Restoration apportionment table. February 2026. Fiscal 2026 final apportionments.